SATELLITE INTELLIGENCE
Ground sensors and bioreactors can tell you exactly what’s happening at one plant or one field — but water-resource decisions often play out at a much larger scale: a whole watershed, an irrigation district, a river basin. No single sensor network can see that far on its own.
AquaSense AI combines our proven sensor and data-science platform with agricultural and satellite data for a wider water-management view. It builds on the same approach that already took BOD monitoring from a multi-day lab wait to continuous, near-real-time tracking in our field proof of concept — and it’s a capability we’re ready to deliver today, for municipal utilities, agricultural cooperatives, and industrial operators who need that wider view.
AVAILABLE NOW • BUILT ON PROVEN CORE TECHNOLOGY • REGIONAL SATELLITE INTELLIGENCE
Why bring satellites into the picture?
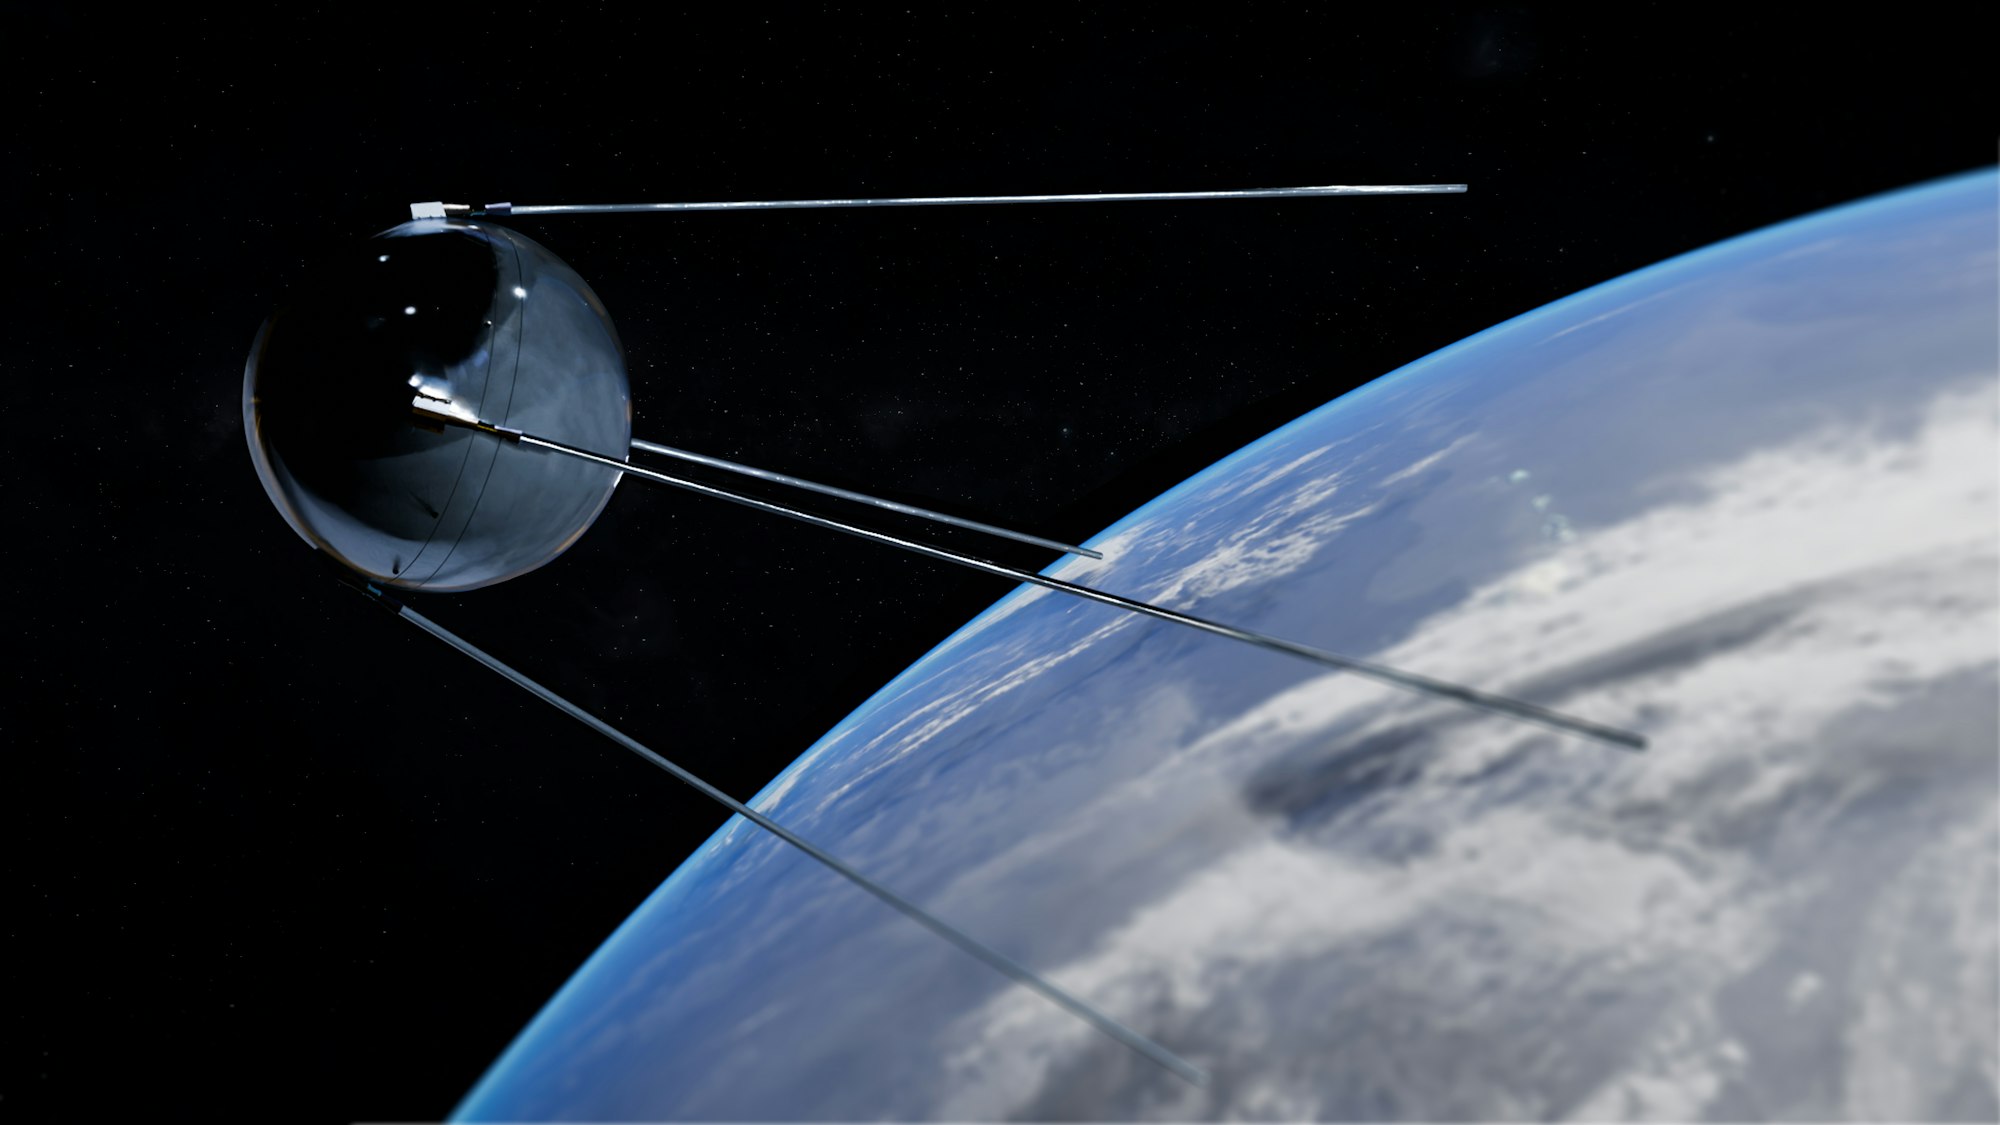
A treatment plant’s sensors and a farm’s irrigation records show what’s happening on the ground, but decisions like how much to draw from a reservoir, when to restrict irrigation, or where reuse makes sense depend on conditions across an entire region. Satellite-based earth observation can offer that wider view — signals related to soil moisture, vegetation health, and surface-water extent, gathered consistently across large areas over time. Combined with ground-truth sensor data, this helps connect what a single plant or field is measuring to the broader water picture around it.
Public earth-observation missions already track this kind of information at basin scale — soil-moisture maps, vegetation-health indices, and surface-water extent are refreshed on a regular cadence and cover entire watersheds, not just a single site. That’s the layer we bring into our platform: pairing what’s already visible from orbit with the on-the-ground precision of our sensors, so a plant manager or an irrigation district can see both the fine detail and the wider regional trend at once.
What this data actually looks like
Earth-observation satellites don’t produce a single number — they produce layered maps. Public missions such as the EU’s Copernicus programme and NASA/USGS Landsat revisit most of the planet every few days, publishing free, open data on soil moisture, vegetation indices, land-surface temperature, and surface-water extent at resolutions from tens of metres down to a few metres per pixel. None of that is proprietary to us — it’s public infrastructure that any team can build on. What we bring is the translation layer: combining that regional picture with our own ground-truth sensors and data-science models, so the output is a decision-ready signal for a specific plant, farm, or utility, not just a raw satellite image. For groundwater specifically, gravity-mapping satellites track shifts in Earth’s gravity field to estimate changes in underground water storage across entire regions — a different kind of regional signal than surface imagery, but public data in the same sense.
A documented case: São Paulo’s 2013–2014 water crisis
This isn’t hypothetical. Published research on the 2013–2014 water crisis in São Paulo — the most severe water supply crisis in the city’s 85-year history — shows what regional satellite data can add to ground monitoring. Cantareira, the system supplying 34.1% of the city’s population, saw its water flow drop 42.3% against its historical average; other municipal systems in the network fell by as much as 28.6%. Accumulated rainfall from October 2013 to February 2014 was 444mm against a historical average of 995mm for the same period, and by October 2014 Cantareira’s stored volume had fallen to just 2.9% of capacity, down from near 100% in January 2010.
Researchers at Brazil’s national space agency and the Renato Archer Center combined data from NASA’s gravity-mapping satellites with a separate NASA land-surface dataset to track groundwater storage under the city as an equivalent water thickness signal, then applied a machine-learning regression method (LS-SVM) to forecast it. They found a strong correlation between the satellite signal and the differential volume of São Paulo’s water-supply system, with around 22 months of historical data producing the most reliable forecasts. The study’s authors point to this kind of satellite-based monitoring as a way to help catch a water-shortage crisis while it’s still developing, rather than after it’s already taken hold.
Source: Ademir L. Xavier Jr. and Sergio Celaschi, “Groundwater monitoring of a hidric shortage crisis in Brazil based on LS-SVM forecasts for the city of São Paulo,” International Journal of Scientific & Engineering Research, Vol. 8, Issue 3, March 2017.
How this builds on what we’ve already proven
This isn’t a leap from nothing. Our field proof of concept — developed through an open-innovation collaboration with SABESP, CTI Renato Archer, CPQD, and FINEP — already showed that continuous, sensor-based monitoring can track alongside the certified lab method, cutting BOD5 turnaround from roughly 7–8 days to 2–3 days. We’ve extended that same approach in stages: single-parameter monitoring, then multi-parameter monitoring, then anomaly detection, prediction, and decision support. Satellite and agricultural data are the layer we now bring in on top of that — widening the view from a single plant to an entire watershed.
Where this could help first
We see the clearest early value in places where regional context changes the picture: helping a municipal utility anticipate reservoir inflow during a dry season, giving an agricultural cooperative a wider view of irrigation demand across a district, or flagging a stretch of river where surface-water extent is shifting faster than ground sensors alone would catch. These are the kinds of engagements we’re ready to scope today.
Questions we hear
Is satellite data part of the platform today? Yes. We combine public satellite missions — including soil-moisture, vegetation, and groundwater-tracking data — with our own ground sensors to give clients a regional view alongside plant-level precision.
Would it replace our ground sensors? No — it sits alongside them. Satellite data adds regional context; our sensors and bioreactors still provide the precise, plant-level readings that regional data alone can’t give.
Does this apply beyond water treatment? Yes — the same logic extends to wastewater, agricultural reuse, and broader water-resource management: anywhere a wider regional view can sharpen a decision that’s currently made with only local information.
What’s still ahead?
Satellite integration is live, built on the same funded, university-backed research foundation as our ground-sensor platform. From here, we’re expanding coverage to more basins and crop systems, deepening the ground-truth calibration in each new region, and pushing our decision-support tools further into automated recommendations. We’ll publish real progress here as that work continues.